


Dashboard
CONTROLS & DISPLAYS
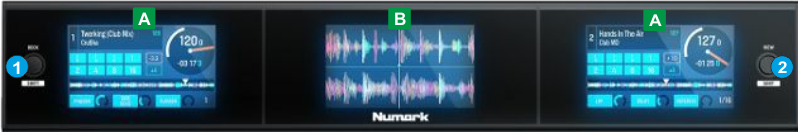
- A Side Deck Displays
B Center Display
CONTROLS
- DECK. Use this button to swap Deck Displays. Both sides will swap decks at the same time. Left side will toggle between Decks 1 and 3. Right side will toggle between Decks 2 and 4
- VIEW. Use this button to toggle between the Performance and the Browser views. See Displays below for details.
When the Browser view is selected, hold DECK button down and then use this button to cycle 3rd Column Browser display between BPM, Key and Length for the Browsed tracks
DISPLAYS
The Displays can have 2 basic views selected via the VIEW button.
Browser View
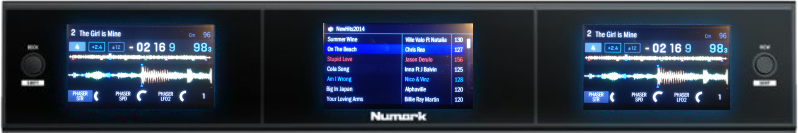
In this view:
- The center screen will display the focused VirtualDJ Browser window (Songs list, Folders list or Sideview List)
- The side screens will display Track Info, song progress bar, waveform and Effects info of the Left and Right selected Decks
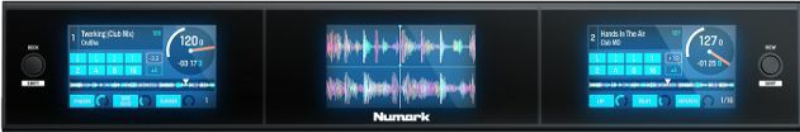
Performance View
In this view,:
- The center screen will display by default the waveforms of the Left and Right selected Decks When any Browser action is executed from any connected MIDI controller, the center screen will display the Browser view and will return automatically to the waveforms display if no Browser action is triggered for 5 seconds. The screen will automatically return to the Waveforms view when a track is loaded from the controller.
- The side screens will display Track Info, song progress bar, a Loop-box with auto-loop sizes, a jogwheel and Effects info of the Left and Right selected Decks
DISPLAY DETAILS
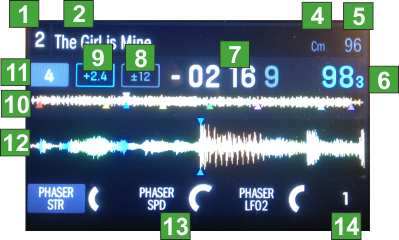
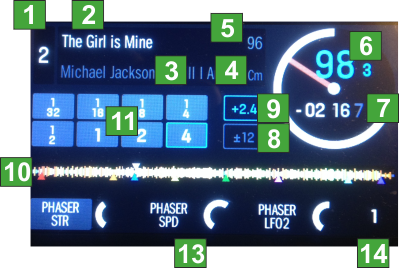
1Deck: Indicates the number of the currently left/right selected deck of VirtualDJ. Press the DECK button to switch between the decks.
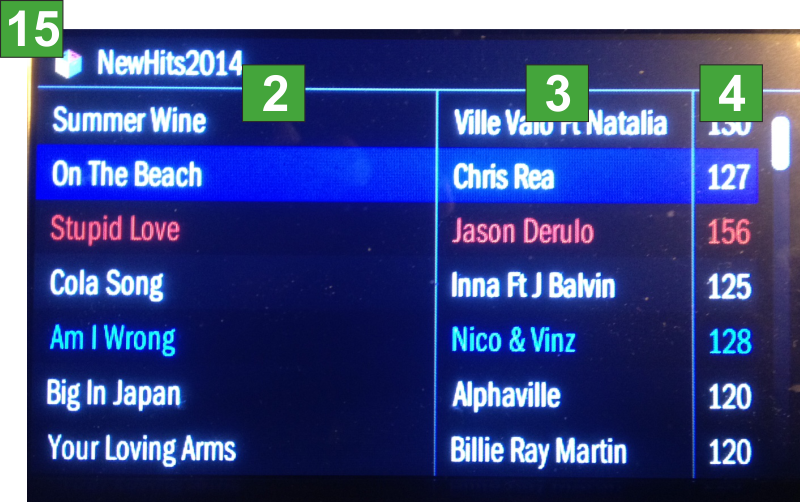
2Track Name: Displays the Title of the currently loaded track. In the Browser Files view, the Column can be adjusted to provide alternative info (see Browser settings)
3Artist Name: Displays the Artist of the currently loaded track. In the Browser Files view, the Column can be adjusted to provide alternative info (see Browser settings)
4Track BPM: Displays the tempo (in beats per minute aka BPM) of the currently loaded track with a 0% pitch adjustment. To see the BPM at which it is currently playing, see Deck BPM below. In the Browser Files view, the Column can be adjusted to provide alternative info (see Browser settings)
5Track Key: Displays the key of the currently loaded track. In Browser view, the Key can be displayed instead of the BPM value via DECK+VIEW button.
6Deck BPM: Displays the current BPM at which the loaded track is playing. This value is not affected by temporary pitch bends (using the Pitch Bend -/+ buttons or the platter).
7Remaining Time: Displays how much time is left of the currently loaded track. Note that the displayed time is not taking the tempo into account (absolute value), so if the current tempo is not equal to the original one, the time will differ from the one that is displayed on the Skin. The ring around the virtual platter is a visual representation of this value (the complete circle being the entire track).
8Pitch Range: Displays the currently selected range of the Pitch Fader.
9Pitch Value This is the current Pitch value
10Track Progress bar: This is the currently loaded track's waveform, which is color-coded according to the frequency of each area: red indicates low (bass) frequencies, green indicated mid-range frequencies, and blue indicates high (treble) frequencies.
In the waveform, hot cue points are represented by triangles at the bottom of the waveform and loop regions are represented by shaded-blue sections.
12Auto-Loop. In Browser View only the deck's currently selected auto-loop length is displayed . In Performance view, the length of each of the 8 Pads in Loop mode is displayed (depending on the selected Bank of the Loop Pads page). Buttons become blue when the corresponding loop is triggered.
12Waveform: This is the currently playing segment of the track's waveform, which will scroll by as the audio play-head moves through the track. The waveform is color-coded according to the frequency of each area: red indicates low (bass) frequencies, green indicated mid-range frequencies, and blue indicates high (treble) frequencies. In the waveform, hot cue points are represented by triangles at the top and bottom of the waveform, and loop regions are represented by shaded-blue sections.
13Effects Info. Displays the names of the selected Effects and their Parameters depending on the Single or Multi Effects selected mode (from the Skin or connected controller)
14Not used: Displays the Effect's Beats value (for the effects that support Effect Beats).
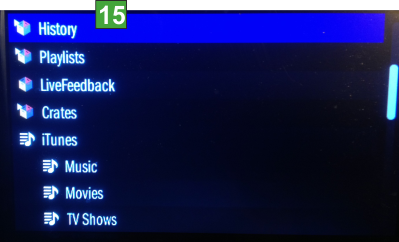
15Folders names Displays the name of the selected folder. In Songs List view, if the Sideview is selected, the name of the selected view will be displayed.